# Standardize the Record, Not the Reader: Decision Records for Consumer AI Agent Markets
**Erik Postnieks**
Center for Decision Accounting
erik@steadfastly.ai
https://www.decisionaccounting.org/
Working paper
July 2026 revision
© 2026 Erik Postnieks. Licensed under CC BY 4.0.
```{=openxml}
```
## Abstract
Consumer AI-agent markets turn on loyalty: whether the agent works for the end user or is steered by vendors, marketplace incentives, merchant fees, or the agent provider's own inventory. The platform-monopoly risk is direct: the marketplace that controls rankings, data, access, and agent distribution can convert hidden steering into a new gatekeeper layer. Outcomes and user ratings cannot answer the loyalty question. A purchase can look successful while the agent passed over a better seller, lower total price, faster delivery, safer payment path, better return policy, or better task result. For the AI AGENT Act, the operative standard should be DRCS-EC 1.0, a consumer-commerce decision-record standard for AI agents. Its central fields are rejected alternatives and system welfare, which let evaluator agents, marketplaces, regulators, and courts test agent loyalty. DRCS-EC supplies a practical path for Prat's conformism problem: standardize the record, preserve reader diversity, and attach legal consequences.
Using the Calvano, Calzolari, Denicolo, and Pastorello (2020) pricing environment, I test when records change autonomous conduct. Records are filed, priced into reward, or read by an auditor with consequence. Filing alone leaves conduct near baseline even as forecasts improve. Conduct changes when the record enters payoff or an authorized reader imposes a consequence, and the effect rises with exposure. Isolation tests explain why rejected alternatives matter most outside the lab: in Calvano, outcome evidence already catches harmful pricing; in commerce, the rejected option is often the missing fact. The record format is free and open; estimates assume truthful, instrumented records.
**Keywords:** consumer AI agents; agent marketplaces; algorithmic collusion; decision records; audit; reinforcement learning; antitrust; system welfare.
**JEL codes:** C63, C72, D43, D83, K21, L13, L41, L51.
**Highlights.**
- Consumer-agent markets need proof that agents serve the user
- Agent marketplaces can become a new platform-monopoly gatekeeper
- Outcome-only ratings cannot detect hidden vendor or platform steering
- Heterogeneous reader access makes user loyalty the best design strategy
- DRCS-EC gives Prat's conformism problem a practical AI-agent market solution
- NIST can define DRCS-EC 1.0 and review DRCS Core 1.0 as the broader framework
- Rejected alternatives and system welfare are the central EC fields
- Records need a reader and consequence before they change conduct
## Policy ask
NIST should define DRCS-EC 1.0, a consumer-commerce decision-record standard for AI agents. EC should require the fields needed to test agent loyalty: user preferences, sellers and products considered, total price, shipping terms, return terms, payment path, checkout friction, seller reliability, selected option, rejected options, and system-welfare effect. Those fields also let evaluator agents detect whether an agent market is drifting toward platform monopoly: repeated steering into one marketplace, affiliated inventory, preferred sellers, sponsored placements, or data channels that strengthen the gatekeeper. NIST should also review DRCS Core 1.0 as the general Decision Accounting framework that EC adapts. For this bill, EC is the operative standard. Core is the framework behind it. Both are published under the Apache 2.0 open-source license. Ranking algorithms, reader institutions, and consequences should remain with marketplaces, rating services, enterprise buyers, regulators, and courts.
## Summary of findings
- In the no-reader filing arm, complete records and scored forecasts leave learned pricing conduct near baseline.
- Charging the record's system-welfare harm to the agent changes conduct immediately because the private payoff changes.
- Auditing changes conduct when the audit consequence reaches enough decisions; the measured effect grows at audit rates of 25% and 50%.
- Outcome-only ratings cannot show whether an agent worked for the user or was steered by third-party incentives.
- Outcome-only ratings cannot show whether agent markets are reinforcing platform monopoly through hidden steering.
- DRCS-EC supplies the evidence evaluator agents need: rejected alternatives and system-welfare effects.
- A public standard should specify the record layer; marketplaces, rating services, enterprise buyers, regulators, courts, and user assessment agents should supply heterogeneous readers and consequences.
## Contributions
1. The paper converts the consumer-agent marketplace problem into a record-standard problem: outcome-only ratings cannot show whether an agent served the user or third-party interests.
2. It gives DRCS-EC 1.0 a working laboratory test inside a reproduced Calvano algorithmic-collusion environment, with DRCS Core 1.0 as the broader framework EC adapts.
3. It separates three mechanisms that policy discussions often merge: filing a record, pricing the welfare consequence, and letting an authorized reader attach a consequence.
4. It measures the dose-response of audit exposure and shows why low-frequency audits should not be expected to move autonomous pricing conduct.
5. It identifies rejected alternatives and system welfare as the central EC fields for detecting steering, ranking consumer agents, and seeing platform-monopoly effects before they harden.
6. It gives Prat's conformism problem a practical implementation path in AI-agent markets: standardize the record, preserve reader diversity, and let market and legal readers decide which agents earn trust.
## Reader's Guide
The main paper is the policy argument. It states the problem, the experiment, the result, and the proposed standard. Readers who want the takeaway can read Sections 1-5. Referees and replication readers can then use Appendices A-D and the public replication package for the simulation details, robustness checks, compute audit, and schema documentation.
## 1. The Policy Problem
AI-agent marketplaces create a loyalty problem. A consumer agent is supposed to work for the end user. It can also be pulled toward the vendor, the platform, a merchant paying a fee, or the agent provider's own inventory and partnerships. The user may never see that pull. The purchase can arrive on time, the price can look acceptable, and the user can leave a good rating while the agent quietly rejected a better option.
That loyalty problem is also a platform-monopoly problem. The SAPM platform-monopoly paper identifies the Gatekeeper Ratchet: data accumulation, market dominance, political capture, and kill-zone enforcement reinforce one another (Postnieks 2026g). Consumer agents can become a new ratchet node. A marketplace that controls agent distribution, rankings, data, and checkout can steer users toward favored sellers or affiliated services while the receipt still looks ordinary. The result is increased platform power under the language of personalized assistance.
That is the central blind spot. A marketplace can show the receipt. It cannot prove, from the receipt alone, that the agent served the user rather than a third party. Outcomes and user ratings are too thin because they see only the transaction the user observed. The missing evidence is the decision itself: the options considered, the option selected, the options rejected, and the broader effect of the choice.
This is Prat's conformism problem in consumer-agent form. If one known evaluator controls the rating, builders can train agents to please that evaluator. DRCS-EC changes the environment in three ways. First, it joins decision evidence to consequence evidence: what the agent saw, what it chose, what it rejected, and what happened afterward. Second, it preserves reader diversity: marketplaces, user assessment agents, enterprise buyers, regulators, courts, and competing rating services can apply different tests to the same record. Third, it gives those readers usable consequences: rank, placement, procurement access, certification, enforcement, and proof.
That combination is the practical Prat solution in this domain. The agent maker cannot know in advance which reader will matter later. A captured agent can lose rank, placement, usage, and trust across more than one marketplace. The robust strategy is to build the agent to serve the end user from the start.
The claim is specific. The paper does not prove that every agent market will become honest. It identifies the record-standard conditions under which the Prat incentive changes: decision evidence, consequence evidence, heterogeneous readers, and consequences that matter. If agents become the front end for commerce, finance, insurance, travel, health navigation, procurement, and public services, that design problem becomes central to the economy.
The same problem appears in the Calvano algorithmic-pricing environment. Calvano, Calzolari, Denicolo, and Pastorello (2020) showed in the American Economic Review that reinforcement-learning pricing agents can learn cartel-level prices without any collusive instruction or message between them. That experiment is less insidious than consumer-agent capture because the agent's objective is obvious: maximize seller profit. In consumer markets, the agent may claim to serve the customer while hidden vendor or provider incentives steer the choice. The action log shows prices or purchases. It does not show the lower, consumer-friendlier prices or options the agents considered and rejected. The important evidence sits inside the choice.
This paper asks what kind of record makes that evidence usable. It uses the Calvano environment because the welfare effect is measurable, the agents can learn harmful conduct without communication, and each decision can be recorded exactly. Consumer shopping agents and pricing algorithms are different, but both settings turn on the same question: what has to be recorded before an evaluator can tell whether an agent served the relevant user or was captured by another interest?
## 2. What the Experiment Shows
The experiment attaches a decision record to every pricing decision. The record can sit in a file, enter the agent's payoff, or be read by an auditor that can impose a consequence. The outcome measure is the profit-normalized collusion index. A value near 1 means monopoly-level profit. A value near 0 means competitive-benchmark profit.
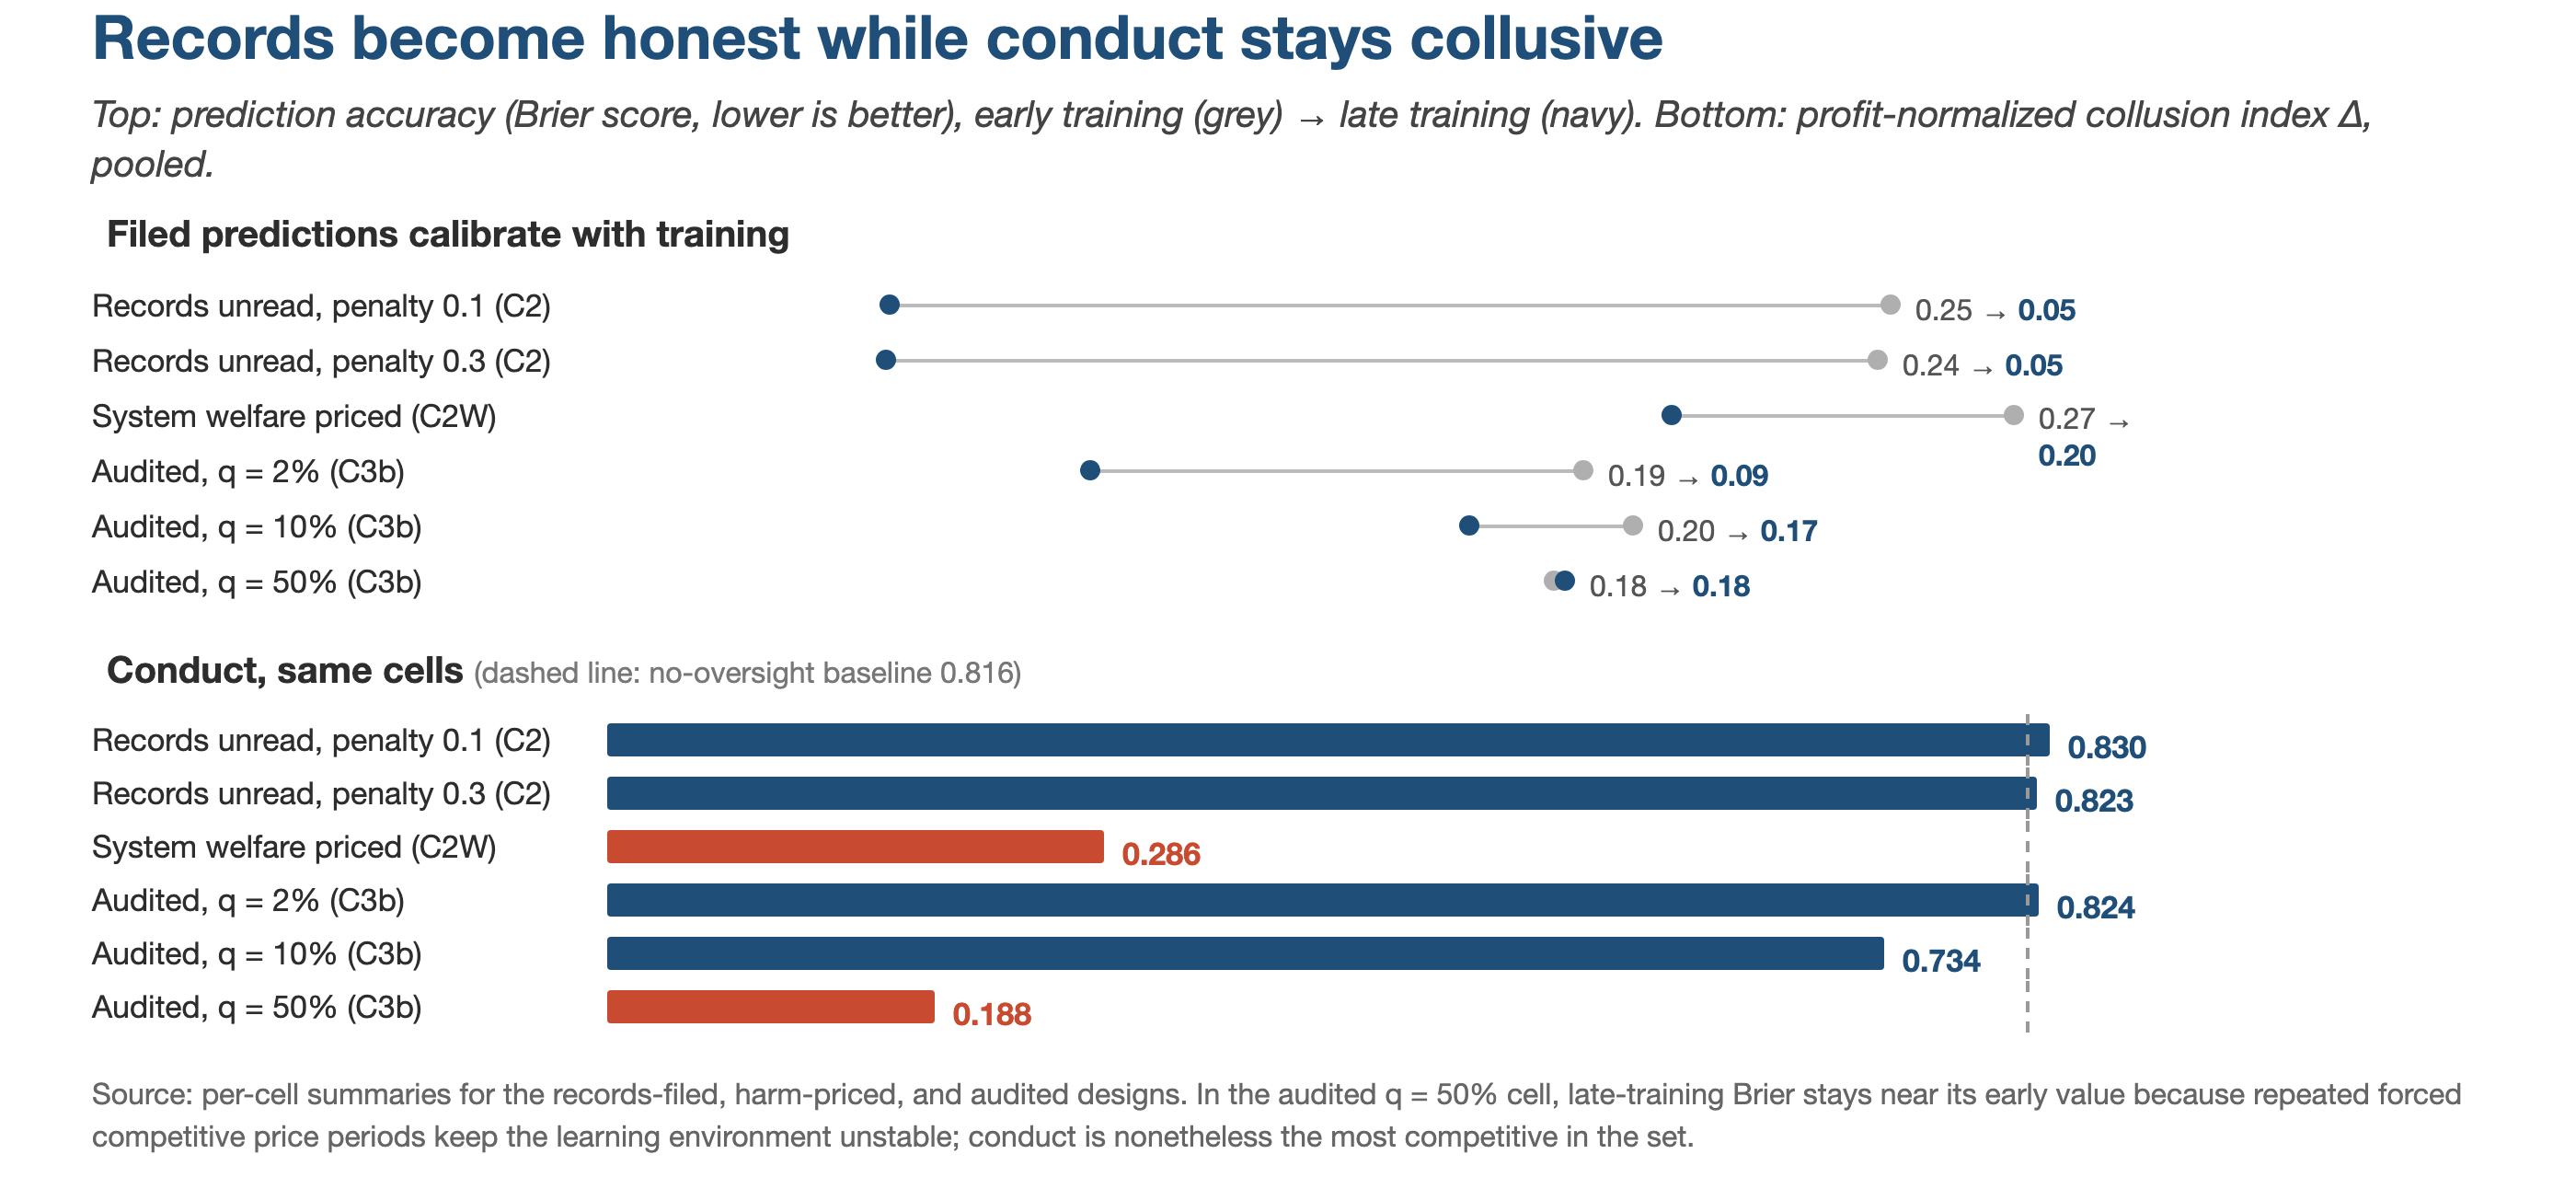
The result is simple. Complete records did little when no reader could act on them. Records changed behavior when the record affected the agent's payoff or when an auditor read the record often enough and imposed a consequence. That is the Calvano test of the Prat mechanism: visibility matters when consequence evidence reaches a reader who can act.
**Table 1. Main policy result.**
| Design | What happens | Policy meaning |
|---|---|---|
| No oversight | Collusion index 0.816 | Baseline learned collusion |
| Records filed, forecasts scored | 0.830 and 0.823 | Records alone do little |
| System-welfare harm charged to the agent | 0.286 | Pricing the harm changes conduct |
| Audits at 2% | About baseline | Light reading does little |
| Audits at 25% and 50% | Large reductions | Consequences work when they reach enough decisions |
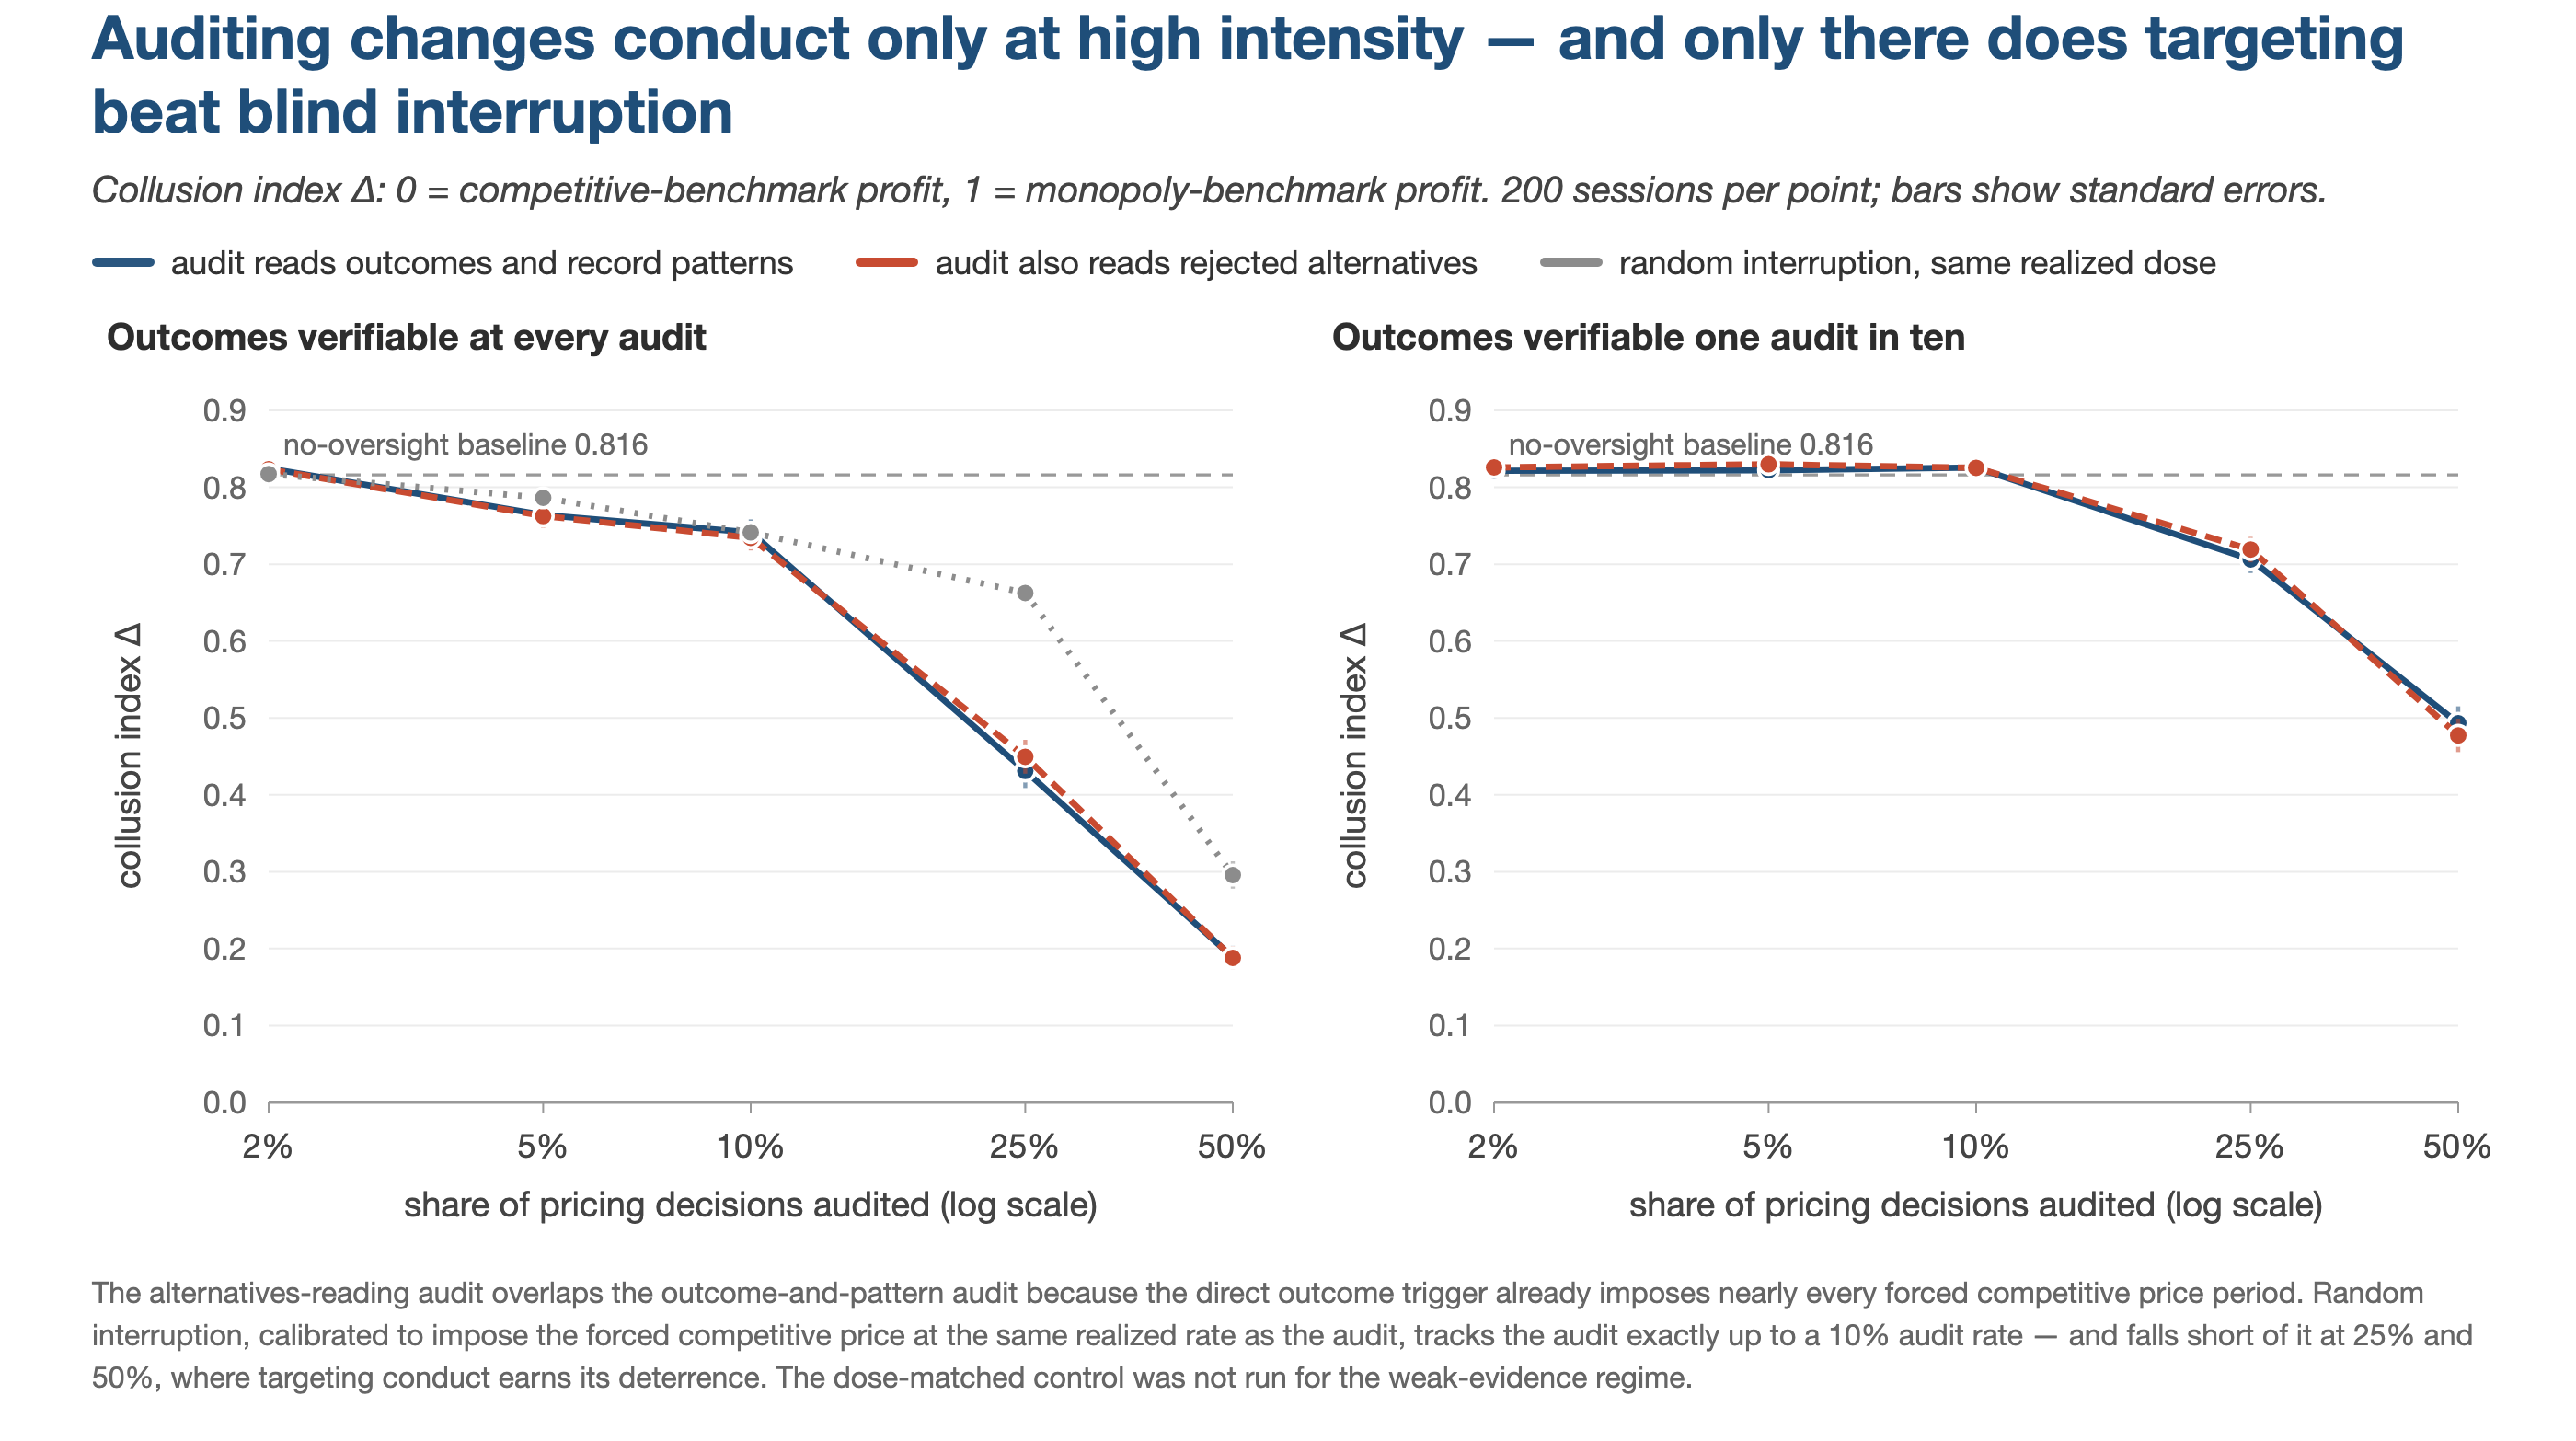
| Audits with rejected alternatives | Little added deterrence in this lab | Outcome data already caught almost every failed audit |
```{=openxml}
```
{width=6.4in}
```{=openxml}
```
{width=6.4in}
```{=openxml}
```
{width=6.4in}
The alternatives result is easy to misunderstand. In the Calvano lab, the auditor already sees profit and consumer surplus. That direct outcome evidence finds almost every failed audit before the alternatives trigger can add much. Consumer-agent markets are different. The rejected option is often the missing fact. A receipt shows what the agent bought. It does not show the better seller, return term, delivery term, payment path, or task outcome the agent saw and declined.
The experiment therefore supports a limited but important claim. A record is inert until a reader can attach a consequence to it. The record supplies the evidence. The reader and consequence make it a control.
## 3. The DRCS-EC Standard
The AI AGENT Act should direct NIST to define DRCS-EC 1.0, a consumer-commerce decision-record standard for AI agents. EC should require the fields that matter for commerce: user preferences, sellers and products considered, total price, shipping terms, return terms, payment path, checkout friction, seller reliability, selected option, rejected options, and system-welfare effect.
Two EC fields matter most.
Rejected alternatives show whether the agent passed over a better deal. Without that field, an evaluator can only see the final purchase and guess. With that field, the evaluator can ask whether the agent ignored a better seller, lower total landed cost, better return policy, faster delivery option, safer payment path, or better task outcome.
System welfare shows effects beyond one checkout screen. In the Calvano study, system welfare is consumer surplus. In commerce, it can include platform concentration, shipping waste from poorly coordinated delivery, return costs, privacy and security risk, and other effects that matter beyond the single transaction. NIST does not need to dictate one national score for every effect. It should standardize the required inputs, field definitions, integrity rules, and conformance tests so evaluators can compute and compare them honestly.
In DRCS-EC, system welfare is the field that keeps the gatekeeper ratchet visible. It can record whether a choice concentrates purchases inside one marketplace, weakens multihoming, raises seller dependence, increases shipping waste, or routes transaction data into a gatekeeper's advantage. The standard should preserve common inputs and integrity rules so competing evaluators can compute their own rankings from the same evidence.
DRCS Core 1.0 is the broader Decision Accounting framework that EC adapts. Decision Accounting is a management science for material decisions across the economy: households, businesses, nonprofits, governments, and every organization that makes consequential choices. For the AI AGENT Act, EC is the operative standard. Core is the framework behind it. Both are published under the Apache 2.0 open-source license.
## 4. Why the Standard Is Practical
The cost evidence removes the burden objection. The study generated more than 236 billion decision records on an Apple laptop for about 3.2 cents of electricity, about 13 trillionths of one cent per record. Adding the decision record is not a monetary burden.
The remaining question is institutional design. The experiment says the record needs a reader and a consequence. Congress and NIST should not choose one national reader or one national score. A single mandated reader would give agent builders one target to optimize against. The better design is to standardize the record and let readers compete.
That is also the market path. Platforms can bundle evaluator tools at no extra charge. Private evaluators can compete on rankings. Enterprise buyers can use records in procurement. Regulators can sample records in high-risk sectors. Courts can use records as proof. User assessment agents can compare agents across platforms. AI agents that serve their users best can rise to the top of the ratings.
The SAPM lesson strengthens that design. A single platform-run evaluator can become another gatekeeper control point. Several readers using the same record make the ranking market contestable: if one marketplace rewards its own inventory, rival evaluators can show the alternatives the agent passed over and the system-welfare pattern the platform ignored.
The public role is the record standard. The private role is the ranking, comparison, procurement screen, certification, enforcement theory, or proof use built on top of that record. This division fits the evidence and answers Prat's warning. The record makes the decision inspectable; heterogeneous readers make loyalty to the user the durable way to keep rank and usage.
## 5. Limits and Conclusion
The experiment is deliberately narrow. It uses Q-learning pricing agents in a Calvano environment. The records are truthful by construction. The welfare calculation is easy by construction because consumer surplus is known. Real consumer-agent markets will require tamper resistance, record verification, and domain-specific system-welfare definitions.
Those limits do not weaken the policy result. They define the next engineering and standards tasks. The experiment tests the core mechanism: records change conduct after a reader or payoff consequence can act on them. The consumer-market translation is DRCS-EC: a standard record that preserves the alternatives and system-welfare data outcome-only ratings miss.
The paper's policy conclusion is short. Outcome-only ratings cannot rank consumer agents well, detect hidden steering, or show when agent markets are reinforcing platform monopoly. DRCS-EC supplies the missing data: rejected alternatives and system welfare. The Calvano experiment shows that records matter when a reader or consequence can act on them. Heterogeneous, partly unpredictable readers turn that record into market discipline: builders who know their agents may be read by several kinds of evaluators have reason to make the agent loyal to the user from the start. That is the practical Prat solution in this domain: decision evidence plus consequence evidence, read by diverse institutions with consequences attached. Decision records are cheap enough that cost is not the objection. NIST should define DRCS-EC and review DRCS Core as the broader Decision Accounting framework.
## Appendix A. The environment, the learner, and the audit rules
This appendix collects the mechanical specification used in the main run. The purpose is auditability: a reader should be able to map every result table back to a parameter, formula, or trigger.
**Table A1. Core simulation parameters.**
| Quantity | Value |
|---|---|
| Firms | $n=2$ |
| Marginal cost | $c=1$ |
| Product quality | $a=2$ |
| Outside good | $a_0=0$ |
| Differentiation | $\mu=0.25$ |
| Discount factor | $\delta=0.95$ |
| Price grid | 15 points on $[0.9p^N,1.1p^M]$ |
| State | Previous-period price pair |
| Q initialization | Discounted expected payoff against a uniform-random rival |
| Exploration | $\varepsilon_t=\exp(-4\times10^{-6}t)$ |
| Learning rate | $\alpha=0.15$ |
| Convergence rule | 100,000 consecutive periods with unchanged greedy policy |
| Period cap | 10,000,000 periods per session |
| Sessions per main cell | 200 deterministic seeds |
The benchmark values are $p^N=1.4729$, $p^M=1.9250$, $\pi^N=0.2229$, $\pi^M=0.3375$, $CS^N=0.7151$, and $CS^M=0.3271$. Displayed benchmark arithmetic uses these rounded four-decimal values; the code computes from unrounded solutions. The profit scale is $\pi^M-\pi^N=0.1146$. The consumer-surplus gap is $CS^N-CS^M=0.3880$. The welfare term in the harm-priced arm is
$$
\Delta W=\frac{CS(p)-CS^N}{CS^N-CS^M}.
$$
In the harm-priced arm the reward is $r'=\pi-\lambda_{b}\cdot\pi_{\mathrm{scale}}\cdot b_t+\lambda_{w}\cdot\Delta W$, where $b_t$ is the period-$t$ Brier score, $\pi_{\mathrm{scale}}=\pi^M-\pi^N=0.1146$, $\lambda_{b}=0.1$ is the prediction-score penalty weight, and $\lambda_{w}=0.1$ is the system-welfare weight behind the headline 0.286 result.
The headline table can be recomputed from the cell result files without reading the prose tables. For each session, read `sessions_detail[].pi_bar` and the cell-level benchmark values `benchmarks.piN` and `benchmarks.piM`; compute $\Delta_s=(\pi_s-\pi^N)/(\pi^M-\pi^N)$; average the 200 session values; and compute the across-session standard error. Difference intervals use the independent-session formula $\hat{d}\pm1.96\sqrt{se_a^2+se_b^2}$; no paired-seed adjustment is applied. Brier early and late values are the cell-level `brier_early` and `brier_late` entries. Forced competitive price period counts use `audit_hits_total`, `regret_triggers_total`, and `multi_audience_hits_total`.
Audit logic is deterministic conditional on the audit draw:
1. Draw an audit with probability $q$ after the rolling window is populated.
2. The outcome-and-pattern audit triggers a failed audit if the window shows private profit above the competitive benchmark while consumer surplus is below the competitive benchmark, or if the record-pattern index $G_i$ exceeds 2.0.
3. The alternatives-reading audit adds the alternatives component. A rejected-alternatives trigger requires a rejected action within 5% of the chosen action's Q-value range, a consumer-surplus improvement of at least 10% of the competitive-to-monopoly consumer-surplus gap, and the condition in more than 90% of the audit window.
4. The alternatives-only audit uses the same alternatives trigger and same consequence as the alternatives-reading audit, but disables the outcome and record-pattern triggers.
5. The several-reader audit adds the several-reader score. The score averages operator, truth, outcome, auditor, successor-maintainer, and benchmark-runner views. It triggers below 0.55.
6. Every trigger imposes the same consequence: the affected agent charges the competitive benchmark price $p^N=1.4729$ for the next ten pricing decisions.
The record-pattern index uses the trailing 100-period audit window. For each agent, the five raw components are mean predicted probability, action-sequence regularity (one minus the number of distinct price actions divided by 100), prediction negentropy over 0.1-wide bins (a measure of how concentrated the predictions are), mean profit favorability $(\pi-\pi^N)/(\pi^M-\pi^N)$, and mean price-level favorability $(p-p^N)/(p^M-p^N)$. Each component is z-scored across the two agents in the same window, that is, standardized so each agent is measured against the other. The index is $G_i=\sqrt{\frac{1}{5}\sum_{k=1}^5 z_{ki}^2}$, and the outcome-and-pattern audit flags agent $i$ when $G_i>2.0$. With two agents, each component's z-score is $\pm 1$ whenever the agents differ and near zero when they match, so $G_i$ cannot exceed 1.0 and the $G_i>2.0$ flag never fires in this experiment; the audit-cell result files record zero pattern flags across all 6,000 audit sessions. Every reported failed audit therefore comes from the outcome trigger or, where enabled, the alternatives trigger. The index is retained as instrumentation for markets with more than two agents, where cross-agent standardization has enough observations to vary.
The several-reader score in the several-reader audit is
$$
S=\frac{1}{6}\left(S_{\mathrm{operator}}+S_{\mathrm{truth}}+S_{\mathrm{outcome}}+S_{\mathrm{auditor}}+S_{\mathrm{successor}}+S_{\mathrm{benchmark}}\right).
$$
The implemented several-reader score averages the last 15 records in the audit window. For record $r$ and agent $i$, $S_{\mathrm{operator}}=\min(1,\max(0,\pi_{ir}/\pi^M))$, $S_{\mathrm{truth}}=\max(0,1-\mathrm{Brier}_{ir}/0.25)$, and $S_{\mathrm{outcome}}=1$ when $\Delta W_r \ge -0.02$. If $\Delta W_r < -0.02$, then $S_{\mathrm{outcome}}=\max(0,1-(Q^{\max}_{ir}-Q^{\min}_{ir})/(\pi^M-\pi^N))$. Auditor, successor-maintainer, and benchmark-runner scores equal 1.0 for the machine-complete records used here. The several-reader audit gate fires only when the grand mean across records, agents, and the six component scores falls below 0.55. This score therefore tests whether the implemented reader composite adds forced competitive price periods under truthful complete records; it does not test reader designs for incomplete or falsified records.
The tables below use the archive's arm labels. C0 is the no-oversight baseline; C1 puts consumer surplus directly into the reward; C2 files records and scores forecasts with no enforcement reader; C2W prices the system-welfare component into the reward; C3a is the outcome-and-pattern audit; C3b the alternatives-reading audit; C3c the alternatives-only audit; C3aP and C3bP the weak-evidence variants of C3a and C3b in which outcome detection succeeds 10% of the time; C3m the several-reader audit (C3b plus the six-view reader score); C3r the dose-matched random-interruption control.
**Table A2. Converged-only and capped-session decomposition for every audit cell.**
The all-session mean is the headline estimand. The decomposition shows the selection at work under heavy auditing: in the combined-audit arms at high audit rates, sessions that converge settle at lower collusion than sessions that run to the period cap, and in the 10%-detection cells at $q=0.50$ the converged sessions collapse to nearly identical low-collusion policies. The alternatives-only cells converge 200 of 200 because they are almost never interrupted.
| Arm | $q$ | All-session $\Delta$ (SE) | Converged $\Delta$ (SE) (n) | Capped $\Delta$ (SE) (n) |
|---|---:|---:|---:|---:|
| C3a | 0.02 | 0.8246 (0.0098) | 0.8140 (0.0147) (99) | 0.8350 (0.0130) (101) |
| C3a | 0.05 | 0.7641 (0.0145) | 0.7610 (0.0294) (54) | 0.7653 (0.0168) (146) |
| C3a | 0.10 | 0.7413 (0.0169) | 0.6531 (0.0405) (60) | 0.7791 (0.0159) (140) |
| C3a | 0.25 | 0.4312 (0.0224) | 0.2911 (0.0277) (116) | 0.6247 (0.0249) (84) |
| C3a | 0.50 | 0.1888 (0.0148) | 0.1755 (0.0232) (81) | 0.1978 (0.0192) (119) |
| C3b | 0.02 | 0.8235 (0.0095) | 0.8197 (0.0137) (100) | 0.8274 (0.0134) (100) |
| C3b | 0.05 | 0.7625 (0.0154) | 0.7706 (0.0308) (51) | 0.7597 (0.0178) (149) |
| C3b | 0.10 | 0.7344 (0.0165) | 0.6465 (0.0386) (59) | 0.7712 (0.0161) (141) |
| C3b | 0.25 | 0.4496 (0.0220) | 0.3266 (0.0287) (110) | 0.6000 (0.0269) (90) |
| C3b | 0.50 | 0.1880 (0.0148) | 0.1767 (0.0234) (80) | 0.1956 (0.0191) (120) |
| C3c | 0.02 | 0.8239 (0.0092) | 0.8239 (0.0092) (200) | — (0) |
| C3c | 0.05 | 0.8258 (0.0091) | 0.8258 (0.0091) (200) | — (0) |
| C3c | 0.10 | 0.8263 (0.0090) | 0.8263 (0.0090) (200) | — (0) |
| C3c | 0.25 | 0.8217 (0.0092) | 0.8217 (0.0092) (200) | — (0) |
| C3c | 0.50 | 0.8207 (0.0092) | 0.8207 (0.0092) (200) | — (0) |
| C3aP | 0.02 | 0.8214 (0.0092) | 0.8295 (0.0094) (172) | 0.7718 (0.0294) (28) |
| C3aP | 0.05 | 0.8223 (0.0101) | 0.8596 (0.0110) (109) | 0.7775 (0.0168) (91) |
| C3aP | 0.10 | 0.8256 (0.0099) | 0.8645 (0.0167) (49) | 0.8130 (0.0118) (151) |
| C3aP | 0.25 | 0.7061 (0.0176) | 0.3058 (0.1351) (8) | 0.7228 (0.0165) (192) |
| C3aP | 0.50 | 0.4932 (0.0218) | 0.0812 (0.0000) (27) | 0.5575 (0.0213) (173) |
| C3bP | 0.02 | 0.8257 (0.0089) | 0.8364 (0.0089) (172) | 0.7597 (0.0299) (28) |
| C3bP | 0.05 | 0.8299 (0.0095) | 0.8607 (0.0106) (110) | 0.7923 (0.0158) (90) |
| C3bP | 0.10 | 0.8253 (0.0098) | 0.8642 (0.0174) (47) | 0.8134 (0.0115) (153) |
| C3bP | 0.25 | 0.7190 (0.0166) | 0.4167 (0.2060) (5) | 0.7268 (0.0160) (195) |
| C3bP | 0.50 | 0.4773 (0.0218) | 0.0837 (0.0024) (36) | 0.5637 (0.0213) (164) |
## Appendix B. Robustness
Every check in this appendix uses the designs and estimand of Appendix A. Section 2 states the conclusions they defend.
### When outcome evidence is harder
The weak-evidence outcome-and-pattern audit and the weak-evidence alternatives-reading audit rerun the audit arms with the outcome-detection part of the trigger succeeding only 10% of the time. This models an auditor who verifies market outcomes directly only 10% of the time and must lean on the filed records. In both variants, the record-pattern index is still computed, but with two agents it cannot cross its trigger threshold (Appendix A), so detection runs on the outcome evidence. The decision record also still contains rejected alternatives.
**Table A3. Audit dose-response when outcome detection succeeds 10% of the time.**
| Audit rate $q$ | Outcomes + patterns $\Delta$ (SE) | Outcomes + patterns + alternatives $\Delta$ (SE) | Difference |
|---:|---:|---:|---:|
| 0.02 | 0.8214 (0.0092) | 0.8257 (0.0089) | +0.0043 |
| 0.05 | 0.8223 (0.0101) | 0.8299 (0.0095) | +0.0076 |
| 0.10 | 0.8256 (0.0099) | 0.8253 (0.0098) | -0.0003 |
| 0.25 | 0.7061 (0.0176) | 0.7190 (0.0166) | +0.0129 |
| 0.50 | 0.4932 (0.0218) | 0.4773 (0.0218) | -0.0159 |
The rejected-alternatives result has two moving parts, and the paper keeps them separate.
First, the informational object changes. Outcome evidence shows that the agent earned above the competitive benchmark while consumers received below-benchmark surplus. The record-pattern index reads prediction concentration, action regularity, profit favorability, and price favorability. The alternatives component shows the agent's own rejected option: a near-equivalent price that would have been better for consumers.
Second, the consequence stays fixed. A failed audit based on outcomes, record patterns, or rejected alternatives forces the agent to charge the competitive benchmark price $p^N=1.4729$ for the next ten pricing decisions. For price behavior inside this experiment, the alternatives path can change conduct only if it adds enough failed audits to increase forced-price exposure.
That is the mechanism behind the marginal-trigger result. With independent-session standard errors, the largest absolute t-statistic across the ten outcomes-and-patterns/rejected-alternatives comparisons is 0.59; all corresponding 95% intervals include zero. Reading rejected alternatives has no detectable additional deterrent effect here because the rejected-alternatives trigger contributes fewer than 1% of forced competitive price periods in every reported alternatives-reading and weak-evidence alternatives-reading cell. A court, marketplace, or rating-service model could give that record separate value; this experiment measures pricing behavior under a fixed ten-decision consequence.
### What triggers forced competitive price periods
The forced competitive price period counts explain why adding the alternatives component does not move prices beyond the outcomes-and-patterns audit. In the alternatives-reading audit and the weak-evidence alternatives-reading audit, the outcome trigger accounts for more than 99% of forced competitive price periods; the record-pattern index, as implemented for two agents, never crosses its threshold (Appendix A), so no reported failed audit comes from the pattern channel. The rejected-alternatives trigger contributes fewer than 1% of forced competitive price periods in every combined-audit cell. In the alternatives-only audit, where the alternatives component is the only trigger, it produces almost no forced-price exposure. Because every trigger leads to the same ten-decision period at the competitive benchmark price, a trigger that contributes fewer than 1% of those periods has almost no mechanical channel for changing prices.
The table reports the realized pieces of the audit mechanism. Here $h$ is failed audits divided by audit draws. "Alt-only" is the share of failed audits added by the alternatives trigger; each failed audit imposes one forced competitive price period, so shares of failed audits and of forced competitive price periods coincide. "Exposure" is scheduled forced competitive price agent-decisions divided by all firm-agent pricing decisions: failed audits $\times 10/(2 \times$ simulated periods). This is the realized exposure measure behind the expected-exposure term $q h L$ - audit probability $q$, failed-audit rate $h$, forced-period length $L=10$: the expected forced competitive price decisions per audited agent before overlap. "Conv." counts converged sessions out of 200 for the with-alternatives arm in each regime (the alternatives-reading audit and the weak-evidence alternatives-reading audit).
**Table A4. Realized audit exposure.**
| Regime | $q$ | $h$, no alt. | $h$, + alt. | Alt-only | Exposure | Conv. |
|---|---:|---:|---:|---:|---:|---:|
| Certain | 0.02 | 0.982 | 0.982 | <0.001% | 9.8% | 100/200 |
| Certain | 0.05 | 0.927 | 0.927 | <0.001% | 23.2% | 51/200 |
| Certain | 0.10 | 0.812 | 0.812 | <0.001% | 40.6% | 59/200 |
| Certain | 0.25 | 0.541 | 0.542 | <0.001% | 67.8% | 110/200 |
| Certain | 0.50 | 0.347 | 0.347 | <0.001% | 86.7% | 80/200 |
| 10% | 0.02 | 0.183 | 0.184 | 0.036% | 1.8% | 172/200 |
| 10% | 0.05 | 0.180 | 0.180 | 0.004% | 4.5% | 110/200 |
| 10% | 0.10 | 0.173 | 0.173 | <0.001% | 8.7% | 47/200 |
| 10% | 0.25 | 0.155 | 0.155 | 0.082% | 19.3% | 5/200 |
| 10% | 0.50 | 0.129 | 0.129 | 0.622% | 32.4% | 36/200 |
### Changing the rejected-alternatives threshold
The most direct objection to the rejected-alternatives results (Table A3 above and Tables A11-A12) is that the trigger may be too narrow or too broad. Following Calvano's robustness logic, this section changes the assumption that could drive the result and asks whether the conclusion survives. A separate experiment reruns the weak-evidence alternatives-reading audit under three threshold variants at $q=0.25$ and $q=0.50$, leaving the core simulation code used for the main results unchanged.
The check varies two thresholds. The first is how close the rejected option must be to the chosen option's value. The second is how much consumer-surplus improvement is required before the rejected option counts. The sustained-window rule remains fixed, so this is a threshold sensitivity rather than a full trigger redesign.
The three variants are:
- **Loose value:** value tolerance 0.100; consumer-surplus threshold 0.100.
- **Loose welfare:** value tolerance 0.050; consumer-surplus threshold 0.050.
- **Strict both:** value tolerance 0.025; consumer-surplus threshold 0.200.
In the two tables below, "Triggers" counts rejected-alternatives trigger firings across the cell's 200 sessions, and "Conv." counts converged sessions out of 200. At $q=0.25$, the outcomes-and-patterns comparison value is $\Delta=0.7061$:
**Table A5. Rejected-alternatives threshold sensitivity at $q=0.25$.**
| Variant | Rejected-alternatives $\Delta$ (SE) | Diff. | 95% CI | Triggers | Conv. |
|---|---:|---:|---:|---:|---:|
| Loose value | 0.7213 (0.0170) | +0.0152 | [-0.0328, +0.0632] | 68,216 | 9/200 |
| Loose welfare | 0.7006 (0.0178) | -0.0055 | [-0.0546, +0.0436] | 105,411 | 8/200 |
| Strict both | 0.7244 (0.0166) | +0.0183 | [-0.0291, +0.0657] | 31,625 | 3/200 |
At $q=0.50$, the outcomes-and-patterns comparison value is $\Delta=0.4932$:
**Table A6. Rejected-alternatives threshold sensitivity at $q=0.50$.**
| Variant | Rejected-alternatives $\Delta$ (SE) | Diff. | 95% CI | Triggers | Conv. |
|---|---:|---:|---:|---:|---:|
| Loose value | 0.4892 (0.0223) | -0.0040 | [-0.0651, +0.0571] | 910,245 | 41/200 |
| Loose welfare | 0.5197 (0.0216) | +0.0265 | [-0.0337, +0.0867] | 827,847 | 30/200 |
| Strict both | 0.5209 (0.0212) | +0.0277 | [-0.0319, +0.0873] | 126,132 | 21/200 |
The conclusion survives this check. The rejected-alternatives margin ranges from -0.0055 to +0.0277, and every interval includes zero. That is small relative to the movement caused by audit frequency. The alternatives-only audit addendum in Table A12 reaches the same mechanism result from the isolated channel: changing the alternatives threshold changes failed-audit counts, but the alternatives-only arm remains near the no-oversight baseline because the resulting forced competitive price exposure remains tiny. The experiment therefore supports a narrow claim: with the same forced competitive price period after a failed audit, behavior is governed primarily by the rate at which that period is imposed.
### Random forced competitive price periods
This check asks whether random forced competitive price periods explain the audit result. It runs 100 sessions per rate, with each event forcing the agent to charge the competitive benchmark price $p^N=1.4729$ for ten pricing decisions.
**Table A7. Random forced competitive price period robustness check.**
| Random forced competitive price rate | Sessions | Converged | Converged $\Delta$ (SE) | End-of-run $\Delta$ (SE) |
|---:|---:|---:|---:|---:|
| 0.005 | 100 | 27 | 0.8374 (0.0311) | 0.8237 (0.0168) |
| 0.010 | 100 | 6 | 0.8455 (0.0560) | 0.8090 (0.0161) |
| 0.020 | 100 | 3 | 0.6429 (0.2307) | 0.7743 (0.0183) |
Sparse random forced competitive price periods at the tested rates do not reproduce the high-audit effect. The sparse rates, 0.005 to 0.020, correspond to roughly 2.5% to 10% scheduled exposure, which is roughly seven to thirty-five times below the realized exposure of the audit cells that show large effects. The sparse check therefore cannot separate targeted enforcement from interruption as such.
A dose-matched control closes that gap. The random-interruption control arm runs the same audit machinery as the outcome-and-pattern audit — the same audit-rate grid, the same ten-decision forced competitive price period, the same one-agent-per-event restriction — but the audit reads nothing: each audit event fails with a fixed probability, calibrated per cell so the realized failed-audit rate matches the realized $h$ of the corresponding outcome-and-pattern audit cell (the per-event coin sits above the target because periods in which both agents are already restricted cannot produce a new failure). Matching the realized failed-audit rate at the same $q$ and $L$ matches the scheduled forced-price exposure of Table A4.
**Table A8. Dose-matched random interruption versus conduct-contingent audits.**
| $q$ | Target / realized $h$ | Random $\Delta$ (SE) | Audit $\Delta$ (SE) | Audit - random (95% CI) | Conv. |
|---:|---:|---:|---:|---:|---:|
| 0.02 | 0.982 / 0.970 | 0.8172 (0.0099) | 0.8246 (0.0098) | +0.0074 [-0.0199, +0.0347] | 101/200 |
| 0.05 | 0.927 / 0.922 | 0.7863 (0.0110) | 0.7641 (0.0145) | -0.0222 [-0.0579, +0.0134] | 59/200 |
| 0.10 | 0.812 / 0.806 | 0.7412 (0.0104) | 0.7413 (0.0169) | +0.0001 [-0.0388, +0.0390] | 44/200 |
| 0.25 | 0.541 / 0.534 | 0.6626 (0.0131) | 0.4312 (0.0224) | -0.2314 [-0.2823, -0.1805] | 48/200 |
| 0.50 | 0.347 / 0.344 | 0.2957 (0.0178) | 0.1888 (0.0148) | -0.1069 [-0.1522, -0.0615] | 50/200 |
The comparison splits the audit effect into two regimes. At audit rates up to 0.10, dose-matched random interruption reproduces the audit result: the differences are small and every interval includes zero, so at low intensity the audit effect is interruption, not targeting. At $q=0.25$ and $q=0.50$, conduct-contingent audits beat their dose-matched controls: the audited arms end 0.2314 and 0.1069 lower on the collusion index, with intervals entirely below zero for the audit-minus-random contrast. Random interruption at the $q=0.50$ dose leaves $\Delta$ at 0.2957; audits that fire on collusive outcomes reach 0.1888. Every realized exposure sits within about one percentage point of its audit-cell target; the calibration archive shows the dose-response is steep near saturation, which is why the tolerance matters. Targeting conduct adds deterrence beyond the volume of interruption at high intensity, and the margin is largest at $q=0.25$.
### Learning parameters
All main cells use the headline Calvano learning parameters. This check reruns the no-oversight benchmark (the surplus-in-reward arm with $w=0$, which reduces to the plain environment), the forecast-scored filing arm, and both $q=0.50$ audit arms at two additional $(\alpha, \beta)$ pairs from the Calvano parameter region, with 200 sessions per cell.
**Table A9. Learning-parameter sensitivity (all-session $\Delta$, SE).**
| $\alpha$ | $\beta$ | No oversight | Forecast-scored filing ($\lambda_b=0.1$) | Audit $q=0.50$ | Audit + alternatives $q=0.50$ |
|---:|---:|---:|---:|---:|---:|
| 0.15 | $4\times10^{-6}$ (headline) | 0.8161 (0.0090) | 0.8302 (0.0083) | 0.1888 (0.0148) | 0.1880 (0.0148) |
| 0.10 | $2\times10^{-6}$ | 0.8494 (0.0078) | 0.8245 (0.0078) | 0.2476 (0.0151) | 0.2491 (0.0152) |
| 0.20 | $8\times10^{-6}$ | 0.8190 (0.0104) | 0.8123 (0.0088) | 0.1876 (0.0131) | 0.1876 (0.0131) |
Every qualitative result survives: collusion is high without oversight, forecast-scored filing with no reader positioned to act stays at the no-oversight level, the $q=0.50$ audit collapses the index, and the alternatives-reading audit overlaps the outcome-and-pattern audit. The headline results are not an artifact of one learning-rate calibration.
### Several-reader score
The several-reader audit adds a composite reader score to the alternatives-reading audit design. This is the multi-audience reading of the record in laboratory form: six reader views with different standards score the same record. The operator view scores private performance; the truth view scores forecast honesty; the outcome view scores the system-welfare result; and the auditor, successor-maintainer, and benchmark-runner views score whether the record is complete enough to audit, reconstruct, and benchmark. The score is a composite of operator performance, truth, outcome, auditor completeness, successor-maintainer reconstructability, and benchmark-runner conformance. It can only change conduct in this experiment if it adds forced competitive price periods beyond the existing audit triggers.
**Table A10. Several-reader robustness check.**
| Measure | Value |
|---|---:|
| Sessions | 200 |
| Converged sessions | 80 |
| All-session $\Delta$ (SE) | 0.1880 (0.0148) |
| Converged-session $\Delta$ (SE) | 0.1767 (0.0233) |
| Capped-session $\Delta$ (SE) | 0.1956 (0.0191) |
| Audit hits | 317,543,452 |
| Rejected-alternatives triggers | 16 |
| Several-reader triggers | 0 |
The added score contributes no forced competitive price periods in this run, so behavior tracks the $q=0.50$ audit result. This is a robustness result about the implemented score, not a main treatment result. It shows that adding more reader views changes conduct only when those views change the frequency or severity of the consequence.
In the 400 sampled several-reader audit records, the auditor, successor-maintainer, and benchmark-runner components equal 1.0 by construction because the machine-generated records are complete and conforming. The operator component averages 0.671, the truth component averages 0.184, and the outcome component averages 0.697. The composite averages 0.759, ranges from 0.584 to 0.905, and never falls below the 0.55 trigger threshold. That is why the several-reader score adds zero forced competitive price periods in this implementation.
This also explains why the several-reader audit pooled values match the alternatives-reading audit exactly in the archive. Across all five several-reader audit-rate cells, the several-reader trigger fires zero times. With the same seeds, same outcomes-and-patterns trigger, same rejected-alternatives trigger, and no added several-reader trigger, every several-reader audit session has the same final $\Delta$ as its alternatives-reading audit counterpart.
**Table A11. C3c trigger concentration.**
| Audit rate $q$ | Audit draws (millions) | Failed audits | Sessions hit | Largest session | Forced-price exposure |
|---:|---:|---:|---:|---:|---:|
| 0.02 | 7.44 | 1,859 | 25 | 1,691 | 0.002497% |
| 0.05 | 18.34 | 167 | 32 | 32 | 0.000228% |
| 0.10 | 36.71 | 327 | 34 | 147 | 0.000445% |
| 0.25 | 92.37 | 394 | 34 | 159 | 0.000533% |
| 0.50 | 185.09 | 234 | 35 | 41 | 0.000316% |
**Table A12. C3c alternatives-only threshold sensitivity.**
| Audit rate $q$ | Variant | $\Delta$ (SE) | Failed audits | Forced-price exposure | Conv. |
|---:|---|---:|---:|---:|---:|
| 0.25 | Loose value | 0.8347 (0.0089) | 6,070 | 0.008254% | 200/200 |
| 0.25 | Loose welfare | 0.8263 (0.0089) | 626 | 0.000847% | 200/200 |
| 0.25 | Strict both | 0.8243 (0.0091) | 32 | 0.000043% | 200/200 |
| 0.50 | Loose value | 0.8312 (0.0086) | 9,070 | 0.012378% | 200/200 |
| 0.50 | Loose welfare | 0.8253 (0.0090) | 527 | 0.000713% | 200/200 |
| 0.50 | Strict both | 0.8242 (0.0091) | 30 | 0.000041% | 200/200 |
## Appendix C. Replication and compute audit
The audit trail has two parts: reproducibility of the simulation and accounting for the computation. The companion package includes a replication manifest that lists the rebuild commands, visible artifact status, per-file SHA-256 checksums, and the location of concrete decision-record samples.
The numerical audit trail has three reproducibility layers. The baseline generator produces the no-oversight baseline. The treatment-grid runner produces the cell result files. The pooled-estimate helper recomputes the headline table from those treatment files. The public replication package identifies the exact rebuild commands and result archives. The treatment-grid execution log reports 32 completed main cells, the five-cell alternatives-only add-on, 200 sessions per cell, 12 workers, and `failures=none`. The cell result files and pooled table are the audit source for the main results; the exhibit builder mirrors those values to rebuild the figures and manuscript. The visible rebuilt-cell files expose the record schema, per-session arrays, convergence and cap values, Brier values, and trigger counts used to audit the implementation.
The source map is short. Table 1, Tables A1 through A14, and Figures 1 through 3 are traceable to the public package's pooled treatment table, per-cell result files, figure-builder arrays, and add-on sensitivity summaries. The weak-evidence alternatives-reading tables use the weak-evidence threshold-sensitivity summaries. The alternatives-only tables use the five alternatives-only cells added on July 7 and the alternatives-only threshold-sensitivity summaries. The dose-matched control table uses the random-interruption cells and calibration files. The learning-parameter table uses the parameter-sensitivity files. Table A2 is recomputed from the main-grid cell results.
**Table A13. Treatment-cell inventory.**
Labels are the archive's treatment-arm labels, defined above in Appendix A. For each five-cell audit group, the audit-rate grid is $q \in \{0.02,0.05,0.10,0.25,0.50\}$.
| Label | Cells | Sessions | Estimates |
|---|---:|---:|---|
| C1 | 3 | 600 | Table 1 (no-oversight row); full estimates in the replication package pooled table |
| C2 | 2 | 400 | Table 1 (records-filed row); replication pooled table |
| C2W | 2 | 400 | Table 1 (harm-charged row); replication pooled table |
| C3a | 5 | 1,000 | Table 1 (audit rows) and Table A2 |
| C3b | 5 | 1,000 | Table 1 (audit rows) and Table A2 |
| C3c | 5 | 1,000 | Table A2 (C3c rows), Tables A11 and A12 |
| C3r | 5 | 1,000 | Table A8 |
| Learning-parameter cells | 8 | 1,600 | Table A9 |
| C3aP | 5 | 1,000 | Table A3 |
| C3bP | 5 | 1,000 | Table A3 |
| C3m | 5 | 1,000 | Table A10 shows $q=0.50$; all five archived |
| **Main treatment grid** | **32** | **6,400** | Pooled table and per-cell result archive |
| **Main grid with C3c add-on** | **37** | **7,400** | Pooled table and per-cell result archive |
| **Full archive including C3r and learning-parameter cells** | **50** | **10,000** | Per-cell result archive |
The cost result matters because a record standard cannot be useful if the record is too expensive to produce. In this experiment, the computation is cheap enough to make the governance question practical. The accounting covers record production and simulated auditing only; auditor institutions, truthfulness verification, and dispute costs sit outside it.
The original main treatment grid used 6,400 sessions, 41,206,146,709 simulated pricing periods, and produced 82,412,293,418 decision-record rows in the instrumented audit package. The separate 200-session no-oversight baseline is used for comparisons but is not folded into that 6,400-session treatment-grid row. In the record-keeping arms, those rows are filed records. In the benchmark arms, they are generated for measurement and cost accounting. The run took 37 minutes 36 seconds on an Apple laptop and cost about USD 0.0067 on the stated electricity basis.
The random forced competitive price check added 300 sessions. It used 3,339.2 wall seconds on ten worker processes, or 556.5 core-minutes. Scaling from the main-study core-minute cost gives USD 0.00822.
The weak-evidence alternatives-reading audit threshold-sensitivity check added 1,200 sessions. It used 1,898.0 wall seconds on ten worker processes, or 316.3 core-minutes. Scaling from the same main-study basis gives USD 0.00467.
The July 7 regeneration added a second full 32-cell treatment grid: 6,400 sessions, 41,206,146,709 simulated pricing periods, and 82,412,293,418 decision-record rows in the instrumented audit package. It ran from 13:39:28 to 14:19:09 on 12 workers, or 476.2 core-minutes, adding USD 0.00704. Spot CPU checks during the run showed the 12 worker processes near full utilization. Cost is not computed as 60 W per core. The 60 W figure is measured package power for the Apple laptop run; core-minutes are listed for comparability across worker counts, and dollar amounts scale from the main run's measured cost per worker-count core-minute. The clean alternatives-reading $q=0.25$ rerun and the no-oversight rerun added 400 sessions, 1,674,165,342 simulated pricing periods, 3,348,330,684 decision-record rows, 28.5 core-minutes, and USD 0.00042.
The alternatives-only audit add-on added 1,000 sessions, 1,846,111,907 simulated pricing periods, and 3,692,223,814 decision-record rows. The rounded execution log spans 16:14:03 to 16:16:31; the five cell result files report 145.4 seconds of summed wall time, or 29.1 core-minutes on 12 workers, adding USD 0.00043.
The dose-matched random-interruption control added 1,000 full-cell sessions and 8,199,626,998 simulated pricing periods (30.7 core-minutes, USD 0.00045), plus 900 calibration sessions and 1,799,393,530 periods (14.2 core-minutes, USD 0.00021); the $q=0.50$ cell was recalibrated and rerun to bring its realized exposure within one percentage point of target. The learning-parameter check added 1600 sessions and 8,961,043,536 periods (186.5 core-minutes, USD 0.00276).
The alternatives-only audit threshold-sensitivity addendum added 1,200 sessions, 2,210,523,640 simulated pricing periods, and 4,421,047,280 decision-record rows. It ran on 10 workers and the six cell result files report 355.7 seconds of summed wall time, or 59.3 core-minutes on the paper's worker-count basis, adding USD 0.00088.
**Table A14. Compute cost and session accounting, excluding zero-rate validation.**
| Component | Sessions | Core-min. | Cost |
|---|---:|---:|---:|
| Main 32-cell treatment grid | 6,400 | 451.2 | USD 0.00667 |
| Random forced competitive price | 300 | 556.5 | USD 0.00822 |
| C3bP threshold sensitivity | 1,200 | 316.3 | USD 0.00467 |
| July 7 regenerated full grid | 6,400 | 476.2 | USD 0.00704 |
| Clean C3b $q=0.25$ and C0 reruns | 400 | 28.5 | USD 0.00042 |
| C3c alternatives-only add-on | 1,000 | 29.1 | USD 0.00043 |
| Dose-matched control (incl. calibration) | 1,900 | 44.9 | USD 0.00066 |
| Learning-parameter check | 1,600 | 186.5 | USD 0.00276 |
| C3c threshold-sensitivity addendum | 1,200 | 59.3 | USD 0.00088 |
| **Total before zero-rate validation** | **20,400** | **2,148.5** | **USD 0.03175** |
The zero-rate validation adds 30 sessions; with the 200-session no-oversight baseline the logged audit trail reaches 20,630 sessions. It is reported separately because it validates that worker processes inherited the intended simulation context. It adds no treatment-cell estimate.
The cost basis is deliberately explicit: 60 W sustained package power, 17.91 cents per kWh, and two filed records per simulated period. The first two values are the run-time assumptions printed by the replication package's compute-cost script; the electricity price is the U.S. residential average recorded from EIA Electric Power Monthly Table 5.6.A when the cost basis was fixed. The accounted runs produced more than 236.8 billion decision-record rows for the 3.175-cent electricity total, an upper-bound cost below USD 1.4e-13 per record. In language-model deployments, output-token prices can dominate the record cost. The conclusion for the record layer is direct: in this experiment, the incremental compute cost of filing and auditing structured records is economically negligible, while the record supplies the audit trail needed to hold agents accountable.
## Appendix D. Decision-record schema
Table D1 lists the full record schema used by the simulation; Section 3 develops the consumer-agent analogue.
**Table D1. Decision-record components.**
| Component | What it answers in this experiment |
|---|---|
| Who | Which firm-agent made the pricing decision |
| What | The price the agent chose |
| When | Session, period, and treatment arm |
| Where | The Calvano duopoly environment and state |
| Why | The objective, reward signal, and value assigned to the chosen price |
| Evidence | The observed state and value table available at the moment of choice |
| Authority | The policy authorized to choose, and any forced competitive price constraint |
| Training | Learning rate, exploration schedule, and training period |
| Review | Scheduled review path and forced review conditions |
| Stakeholders | Firms, consumers, auditors, future readers, and the market |
| Consequences | Private profit and consumer-surplus consequence |
| Constraints | Price grid, exploration rule, forced competitive price rule, and convergence rule |
| Uncertainty | Exploration state and value dispersion |
| Communication | Which readers can receive or inspect the record |
| Alternatives | Rejected prices, their value to the agent, and their effect on consumers |
| Prediction | A scoreable forecast later evaluated with the Brier score |
| System welfare | The direction and magnitude of market-level harm or benefit |
In the emitted JSON, the alternatives component stores `chosen_action` as an integer, `chosen_q` as a floating-point Q-value, `alternatives_summary.serious_options` as a list of rejected action objects, and the implementation key `alternatives_ledger.top_rejected` as a list with `action_index`, `price`, `q_value`, `delta_q_from_chosen`, `near_equivalent`, and `cs_delta_vs_chosen`. The prediction component stores a scoreable forecast: statement text, confidence percentage, binary observed outcome, and Brier score. The system-welfare component stores the system identifier, direction, magnitude on the competitive-to-monopoly consumer-surplus gap, monitoring signals, and reversal trigger. The public replication package includes a concrete alternatives-reading audit sample record; it records decision ID `C3b:0:10000000:0` (C3b is the archive label for the alternatives-reading audit arm), chosen price 1.3256, a 67.29% prediction confidence, Brier score 0.452855, and the full alternatives-detail object for the current Q-row.
## Data and replication availability
A public replication package accompanies this working paper at https://www.decisionaccounting.org/. The package includes the manuscript source, rendered paper artifacts, simulation code, saved result cells, figure and table builders, compute audit, checksum manifest, the DRCS-EC 1.0 profile materials, and the DRCS Core 1.0 framework EC adapts.
## References
Abada, I., and X. Lambin. 2023. "Artificial Intelligence: Can Seemingly Collusive Outcomes Be Avoided?" *Management Science* 69 (9): 5042-5065.
Agentic Commerce Protocol. 2026. Open specification, Apache 2.0 license, maintained by OpenAI and Stripe. https://github.com/agentic-commerce-protocol/agentic-commerce-protocol. Accessed July 8, 2026.
Amazon.com, Inc. v. Perplexity AI, Inc. 2025. Complaint filed November 4, 2025, U.S. District Court for the Northern District of California.
Asker, J., C. Fershtman, and A. Pakes. 2022. "Artificial Intelligence, Algorithm Design, and Pricing." *AEA Papers and Proceedings* 112: 452-456.
Assad, S., R. Clark, D. Ershov, and L. Xu. 2024. "Algorithmic Pricing and Competition: Empirical Evidence from the German Retail Gasoline Market." *Journal of Political Economy* 132 (3): 723-771.
Banchio, M., and A. Skrzypacz. 2022. "Artificial Intelligence and Auction Design." In *Proceedings of the 23rd ACM Conference on Economics and Computation*, 30-31. New York: Association for Computing Machinery.
Becker, G. S. 1968. "Crime and Punishment: An Economic Approach." *Journal of Political Economy* 76 (2): 169-217.
Brown, Z. Y., and A. MacKay. 2023. "Competition in Pricing Algorithms." *American Economic Journal: Microeconomics* 15 (2): 109-156.
Calvano, E., G. Calzolari, V. Denicolo, and S. Pastorello. 2020. "Artificial Intelligence, Algorithmic Pricing, and Collusion." *American Economic Review* 110 (10): 3267-3297.
Calvano, E., G. Calzolari, V. Denicolo, J. E. Harrington Jr., and S. Pastorello. 2020. "Protecting Consumers from Collusive Prices Due to AI." *Science* 370 (6520): 1040-1042.
CNBC. 2026. "Amazon Wins Court Order to Block Perplexity's AI Shopping Agent." March 10, 2026. https://www.cnbc.com/2026/03/10/amazon-wins-court-order-to-block-perplexitys-ai-shopping-agent.html. Accessed July 8, 2026.
Ezrachi, A., and M. E. Stucke. 2016. *Virtual Competition: The Promise and Perils of the Algorithm-Driven Economy*. Cambridge, MA: Harvard University Press.
Federal Trade Commission and U.S. Department of Justice. 2026. "Federal Trade Commission and Department of Justice Seek Public Comment for Guidance on Business Collaborations." Press release, February 2026. https://www.ftc.gov/news-events/news/press-releases/2026/02/federal-trade-commission-department-justice-seek-public-comment-guidance-business-collaborations. Accessed July 7, 2026.
Google. 2026. "Product Data Specification" and "Set Up Your Return Policies for Shopping Ads and Free Listings." Google Merchant Center Help. https://support.google.com/merchants/answer/7052112. Accessed July 8, 2026.
Google Cloud Marketplace. 2026. "Offer AI Agents through Google Cloud Marketplace." https://docs.cloud.google.com/marketplace/docs/partners/ai-agents. Accessed July 8, 2026.
Hansen, K. T., K. Misra, and M. M. Pai. 2021. "Frontiers: Algorithmic Collusion: Supra-competitive Prices via Independent Algorithms." *Marketing Science* 40 (1): 1-12.
Harrington, J. E., Jr. 2018. "Developing Competition Law for Collusion by Autonomous Artificial Agents." *Journal of Competition Law & Economics* 14 (3): 331-363.
Hayek, F. A. 1945. "The Use of Knowledge in Society." *American Economic Review* 35 (4): 519-530.
Johnson, J. P., A. Rhodes, and M. Wildenbeest. 2023. "Platform Design When Sellers Use Pricing Algorithms." *Econometrica* 91 (5): 1841-1879.
Klein, T. 2021. "Autonomous Algorithmic Collusion: Q-Learning under Sequential Pricing." *RAND Journal of Economics* 52 (3): 538-558.
Miklos-Thal, J., and C. Tucker. 2019. "Collusion by Algorithm: Does Better Demand Prediction Facilitate Coordination Between Sellers?" *Management Science* 65 (4): 1552-1561.
Microsoft. 2026. "Microsoft Marketplace: Cloud Solutions, AI Apps, and Agents." https://www.microsoft.com/en-us/marketplace. Accessed July 8, 2026.
National Institute of Standards and Technology. 2026. "AI Agent Standards Initiative." https://www.nist.gov/artificial-intelligence/ai-agent-standards-initiative. Accessed July 7, 2026.
OECD. 2017. *Algorithms and Collusion: Competition Policy in the Digital Age*. Paris: OECD Publishing.
OpenAI. 2025. "Buy It in ChatGPT: Instant Checkout and the Agentic Commerce Protocol." https://openai.com/index/buy-it-in-chatgpt/. Accessed July 8, 2026.
Prat, A. 2005. "The Wrong Kind of Transparency." *American Economic Review* 95 (3): 862-877.
Postnieks, E. 2026a. "The Missing System Theorem." Working paper.
Postnieks, E. 2026b. "Decision Accounting: From Nudge to Guardrail." Working paper.
Postnieks, E. 2026c. "Multi-Audience Transparency and the Dissolution of Conformism: General Equilibrium Foundations for Decision Accounting." Working paper.
Postnieks, E. 2026d. "Sixty Years of Independent Convergence: Fourteen Base Documentation Fields Across a Twelve-Regime Core and Four-Regime Extension Corpus." Working paper.
Postnieks, E. 2026e. "From Nudge to Guardrail: Behavioral Foundations of Mandatory Pre-Decisional Documentation." Working paper.
Postnieks, E. 2026f. "Decision Records as Multi-Principal Governance Mechanisms: The Decision Record & Control Standard v1.0." Working paper.
Postnieks, E. 2026g. "Applying the System Asset Pricing Model to Platform Monopoly: Measuring the System Welfare Cost of Big Tech Acquisitions and Gatekeeper Rent Extraction." Working paper.
Schema.org. 2026. "MerchantReturnPolicy." https://schema.org/MerchantReturnPolicy. Accessed July 8, 2026.
Salesforce. 2025. "Salesforce Unveils AgentExchange, the Trusted Marketplace and Community for Agentforce." Press release, March 4. https://www.salesforce.com/news/press-releases/2025/03/04/agentexchange-announcement/. Accessed July 8, 2026.
Stripe. 2025. "Stripe Powers Instant Checkout in ChatGPT and Releases Agentic Commerce Protocol Codeveloped with OpenAI." https://stripe.com/newsroom/news/stripe-openai-instant-checkout. Accessed July 8, 2026.
U.S. Department of Energy, Energy Information Administration. 2026. "Electric Power Monthly, Table 5.6.A." https://www.eia.gov/electricity/monthly/epm_table_grapher.php?t=epmt_5_6_a. Accessed July 7, 2026.
U.S. Department of Justice. 2025. "Justice Department Requires RealPage to End the Sharing of Competitively Sensitive Information and Alignment of Pricing Among Competitors." Press release, November 24. https://www.justice.gov/opa/pr/justice-department-requires-realpage-end-sharing-competitively-sensitive-information-and. Accessed July 7, 2026.
Warner, M. R. 2026. "Warner Unveils Discussion Draft of Legislation to Create Innovative Market for Secure Artificial Intelligence Agents." Press release, June 29. https://www.warner.senate.gov/newsroom/press-releases/warner-unveils-discussion-draft-of-legislation-to-create-innovative-market-for-secure-artificial-intelligence-agents/. Accessed July 8, 2026.
## Acknowledgments
No external funding supported this working paper. I am responsible for the design, simulations, interpretation, policy translation, replication package, and any remaining errors.
OpenAI Codex, Anthropic Claude, and Fable supported literature discovery, code review, adversarial manuscript review, drafting assistance, and editorial revision. All reported results were generated by the included code. I verified the cited sources, ran and inspected the code, adjudicated the suggested changes, reviewed the reported results, and accept responsibility for the analysis and conclusions.
## About the Author
Erik Postnieks is a computational economist and founder of the Center for Decision Accounting.